Business Intelligence Specialist · 8+ years experience
Turning complex data into trusted decisions.
I help organisations move from guesswork to evidence-based action — through reporting that’s accurate, accessible, and actually adopted by the people who need it.

I’ve spent 8+ years building reporting solutions in enterprise BI environments — from migrating legacy reporting platforms to delivering scalable dashboards on modern analytics tools. SQL sits at the heart of how I model, validate, and surface data, so every number can be traced and trusted before it ever reaches a stakeholder.
My work bridges technical systems and real business needs. I focus on clarity, governance, and usability — making sure insights aren’t just accurate, but adopted by the people they’re meant to inform.
8+ Years’ Experience


Beyond dashboards and metrics, I bring a strategic, human-centred perspective. The best reporting doesn’t just describe what’s happening — it sparks the right questions and empowers people to act with confidence.
Specialising in: Tableau · Power BI · SQL (T-SQL · PostgreSQL) · Excel & Power Query · enterprise BI migration · dashboard development · stakeholder-focused reporting
My Skills
Tools
Capabilities
My Dashboard Projects
TV Viewership Trends
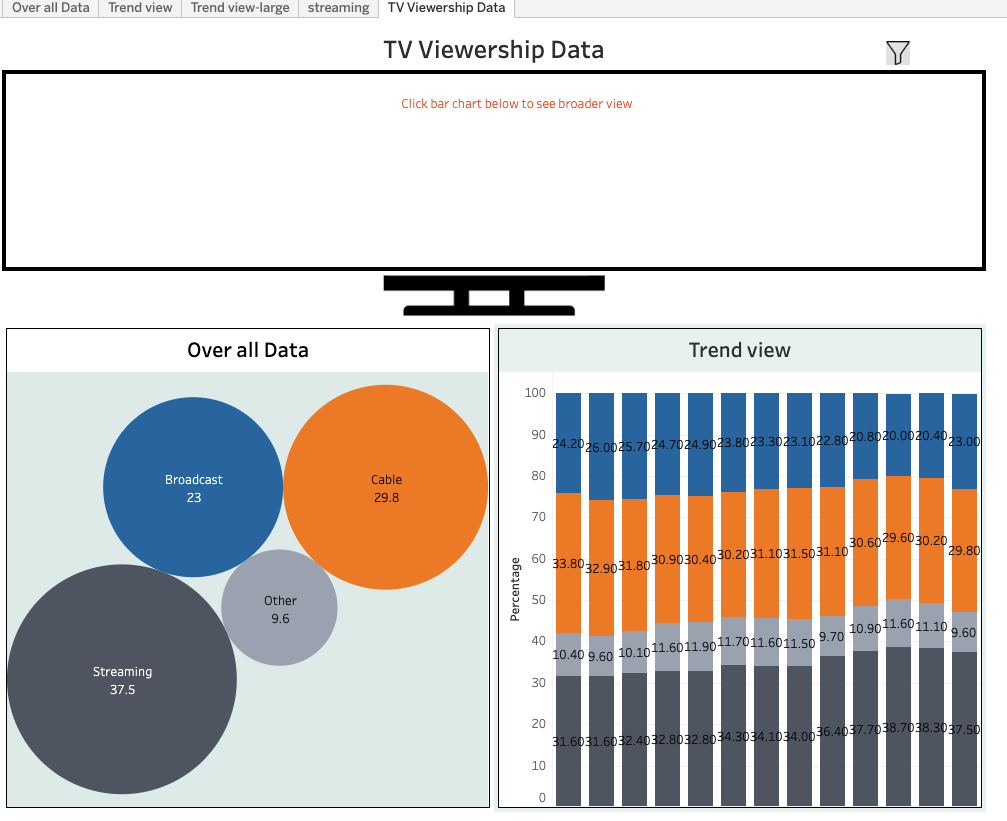
Tableau dashboard analysing broadcast, cable, streaming and other channel viewership. Streaming overtakes traditional formats year-on-year.
Most Innovative Companies (2018)
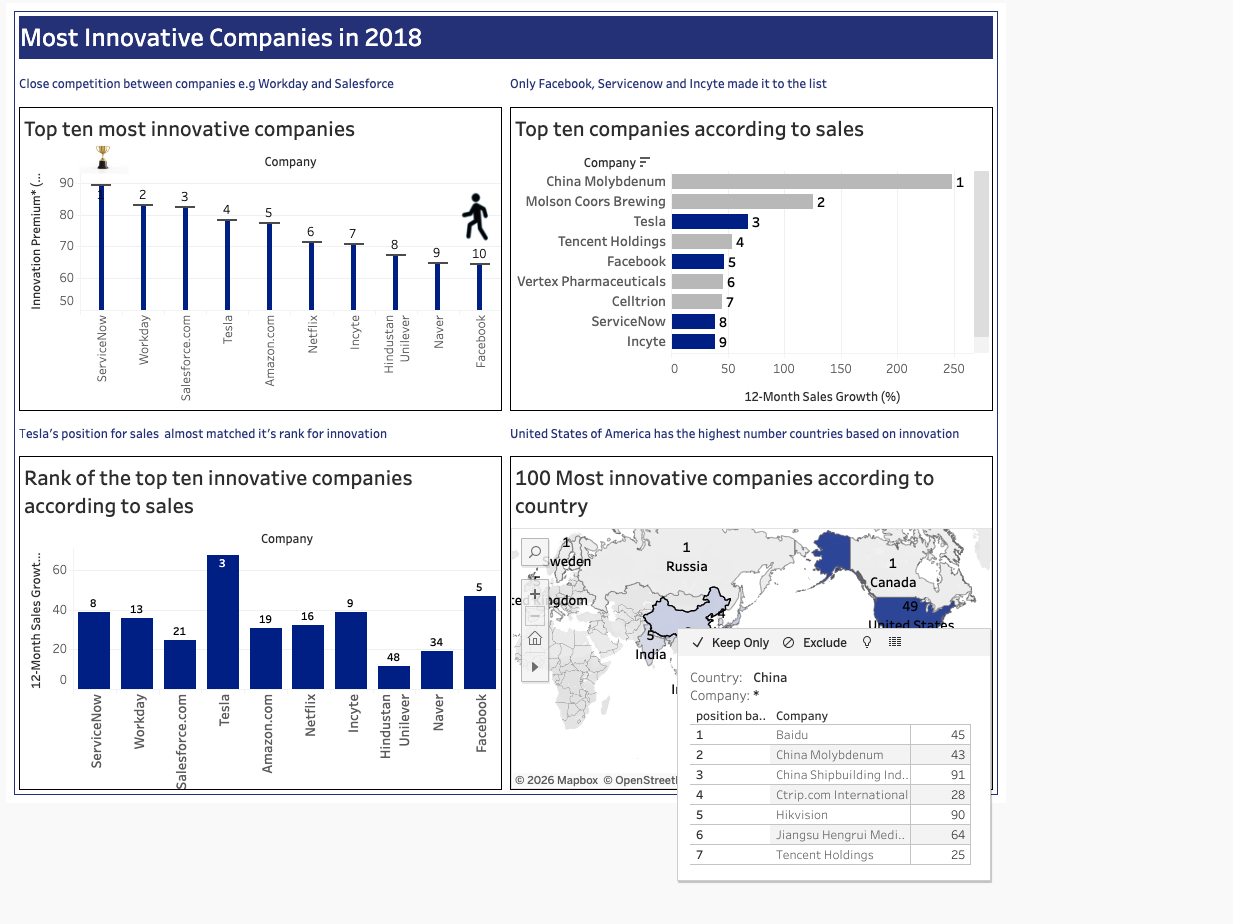
Tableau dashboard ranking Forbes’ top 10 most innovative companies, comparing innovation score with sales growth and geographic spread.
U.S. Presidential Elections (1976–2020)
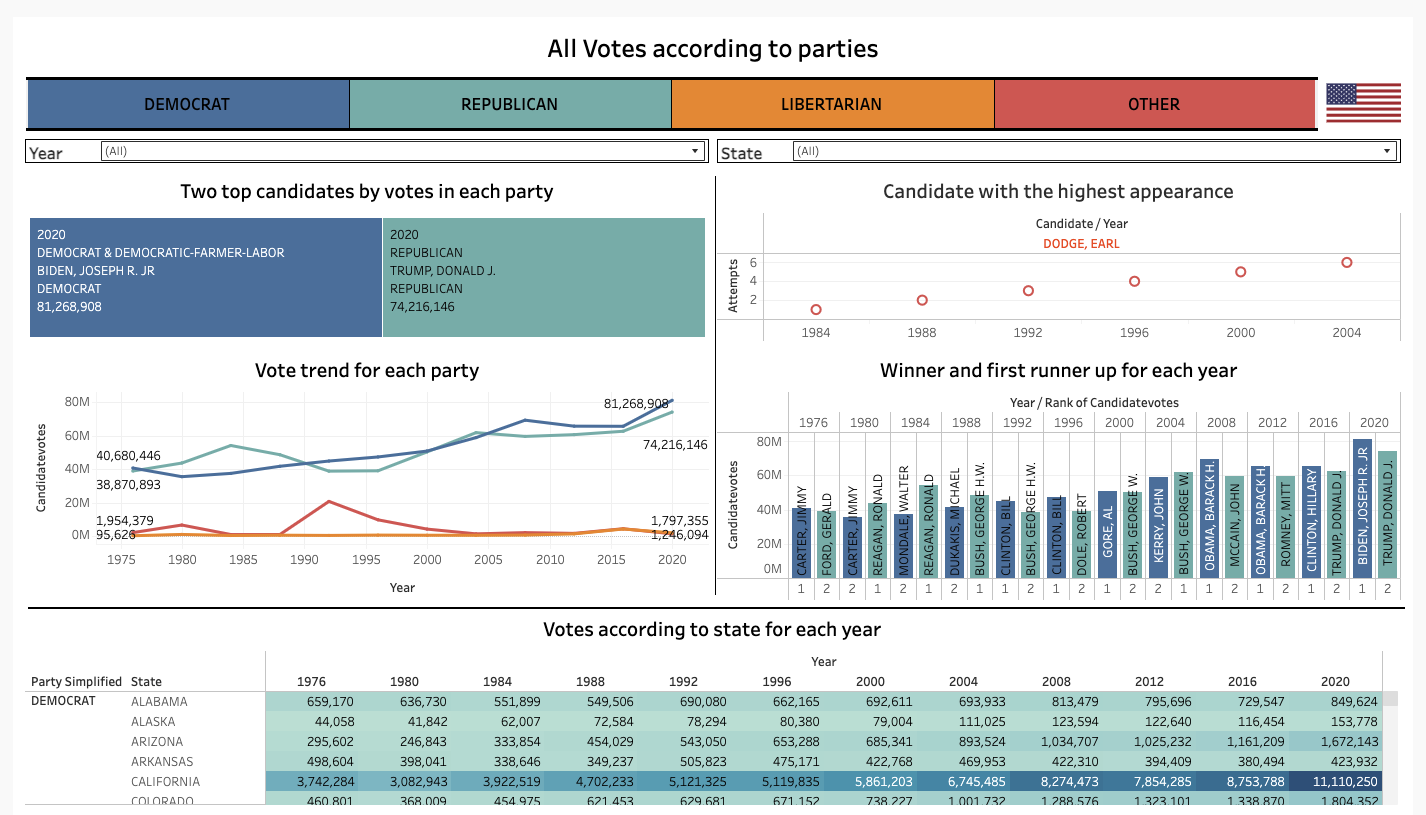
Tableau dashboard exploring votes by party, top candidates, multi-decade vote trends, and state-level results with year and state filters.


