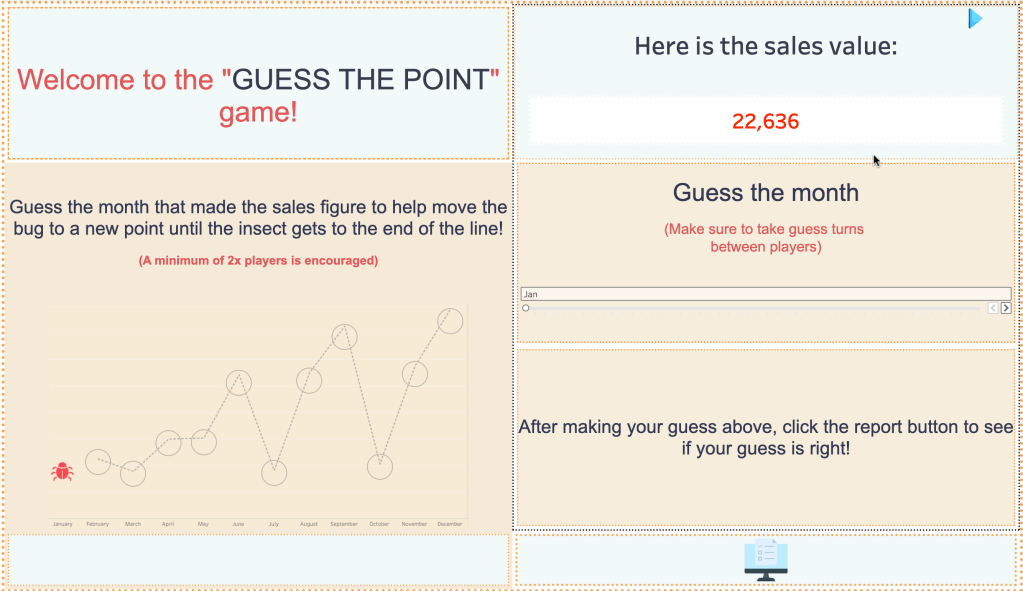
What Is “Guess the Point”?
“Guess the Point” is a custom Tableau game. Players take turns guessing which month corresponds to a displayed sales value. Each correct guess moves a bumblebee icon ahead along a line chart. Here’s the twist:
➡️ Sometimes the bee moves down the line. Don’t let that discourage you! One more correct guess will lift the bee back up. Just like in business: some months are slow, but the trend is what matters.
Why This Game Works
– Teaches how to build and read a line chart
– Introduces gamification into data learning
– Promotes team collaboration
– Helps users explore sales data — even if they don’t already know it
How Many Players?
At least 2 players for a better experience — more players = more fun.
What Dataset
The sample EU superstore dataset
What You’ll Need
Four worksheets and one dashboard in Tableau.
How the Game Works
Step 1: Build the Line Chart
– Use Sales for the Y-axis
– Extract Month name from Order Date, filtered to the lowest year
– Exclude NULL values
– Format to hide axis labels and tooltips (no clues!)
Step 2: Create Parameters
– Clicked Point parameter: stores the user’s guess (a month)
– Sales Parameter: stores the month that corresponds to the sales value for the lowest year in the dataset i.e. year 2020
(Tip: Shuffle the months so users can’t guess based on order!)
Step 3: Move the Bumblebee
A calculated field identifies the correct point:
IF DATENAME(“month”, [Order Date]) = [Sales Parameter Field]
AND YEAR([Order Date]) = [Minimum Year] THEN “True”
ELSE “Null”
END
– Assign the bumblebee icon to “True”
– All other points remain neutral
Step 4: Show the Result
Another field displays feedback:
IF [Clicked Point] = [Sales Parameter Field] THEN
IF [Sales Parameter Field] = “December” THEN “🎉 Correct! Game Over!”
ELSE “✅ Correct! Keep Going!”
ELSE “❌ Wrong! Try Again”
END
Step 5: Show/Hide the Line Chart (Only When Correct)
Use a field to control visibility:
[Clicked Point] = [Sales Parameter Field]
Apply it to the Filter shelf to only show the chart when a correct guess is made. This creates the illusion of unlocking the bee’s movement.
Key Learning Benefits
– Reinforces how Tableau builds a line chart
– Encourages users to engage with real sales data
– Builds storytelling intuition (e.g., why did the bee go down?)
– Makes Tableau training visual, fun, and memorable
Dashboard Tips
– Add icons, a “Check Answer” text box, and clear instructions
– Hide the parameter controls behind a floating container
– Use a Show/Hide button to toggle between the dashboard and feedback view
– Make sure to hide the Worksheet for a better user experience
End of the Game
Once the bee lands on December and the user guesses correctly, they’ll see:
🎉 Correct! Game Over!
You can even celebrate with confetti or a GIF!
Final Thoughts
“Guess the Point” is a fun way to build Tableau skills while promoting teamwork and data familiarity. You might be running a data bootcamp. Perhaps you just want to spice up a training session. This game makes learning fun, visual, and collaborative.
Download the step-by-step guide as a Word document or reach out for a live demo!
🎁 Want to build this game or try it out with your team?
📌 Have you ever gamified your dashboards? I’d love to hear your creative use of Tableau for learning and play!
Link to the workbook on Tableau Public:


Leave a comment